Analyzing Brewery Production Data
In Python and Power BI
This project was an analysis of primarily packaging data for a large scale production craft brewery in the US. It sourced user entered data from Packaging Operators upon completion of each packaging run. This data was then transfomed and analyzed to provide insight on throughput capability, product popularity and volume loss based on different brands and product type. Months were separated by different tabs on the sheet with a monthly total table at the bottom and an additional yearly total tab.
Brand names and other identifying information has been changed to protect anonymity.
Initial Data Source
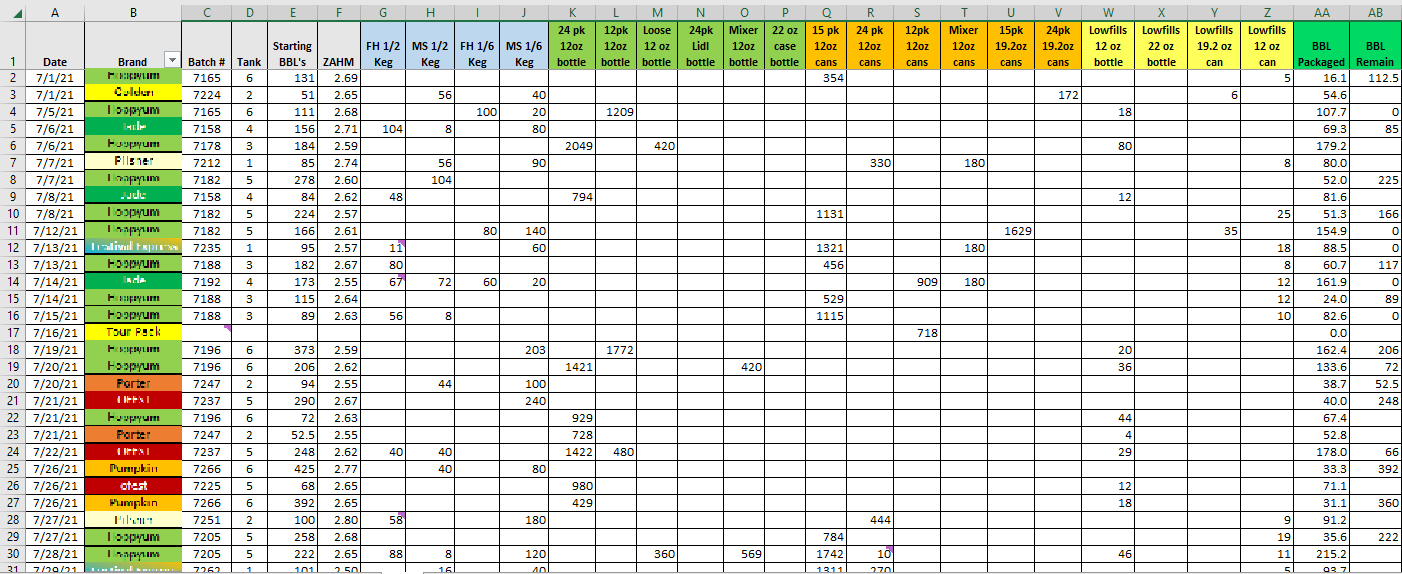
Each packaging run comprised a row in an Excel spreadsheet. The packaging operator was tasked with entering the number of units packaged in each corresponding row, each row being a different type of packaging.
Concatenate Month Tabs into Master Dataset
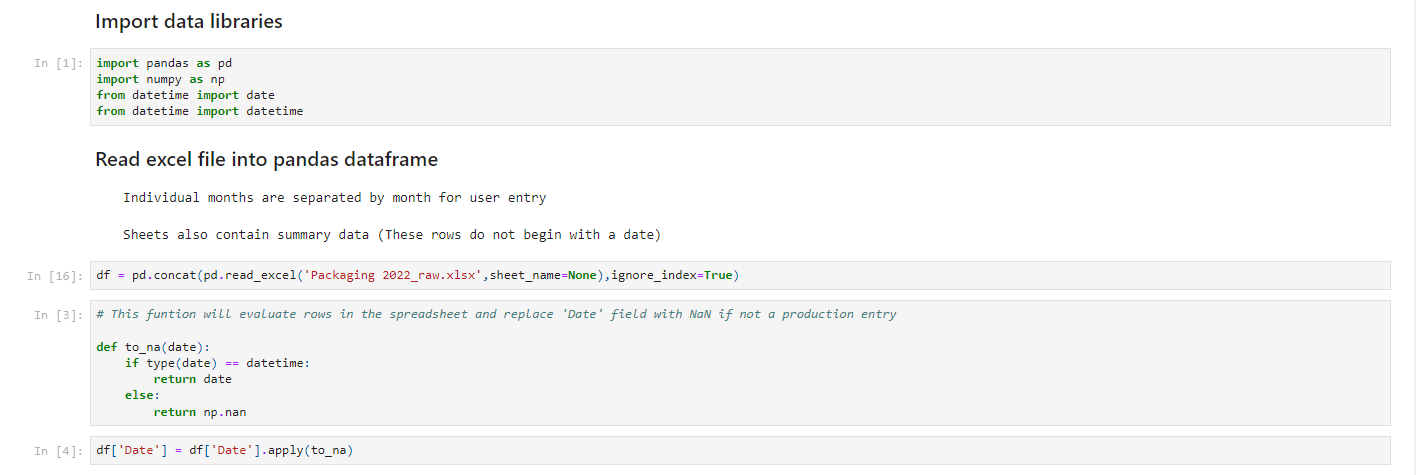
Initial Excel file was read into Python DataFrame. Month tabs were concatenated and non-needed rows eliminated to fit specified format for Power BI report.
Transforming Data in Power BI
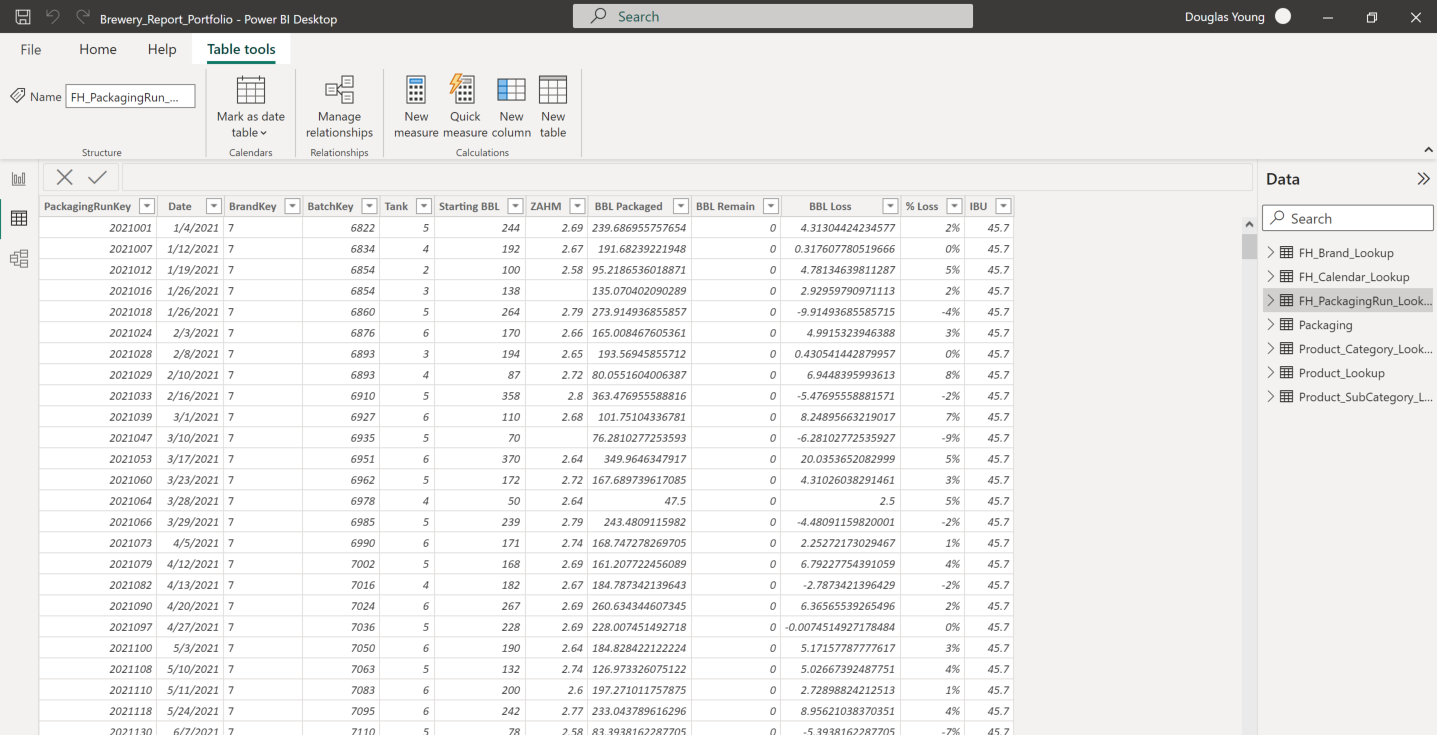
Raw source data was imported to Power BI where packaging information was split into two tables. Packaging Run Lookup table corresponded to each run, regardless of different Product types packaged, maintaining information about each run including Brand, Packaging Tank, Carbonation Level, Volume packaged and Volume Loss during the run.
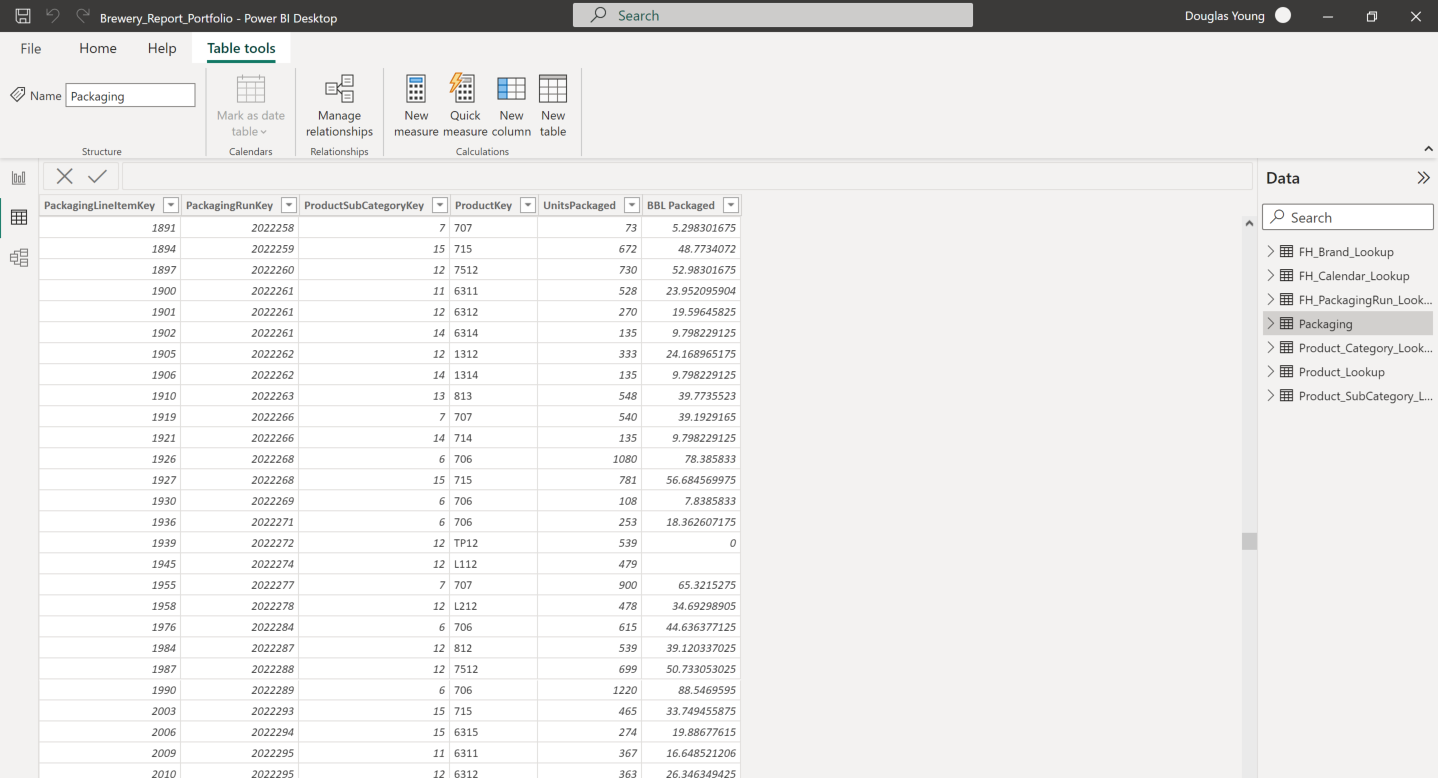
The second table contained each Product itemized by Product Key, Units Packaged and Package Volume per line item.
Relational Tables Created
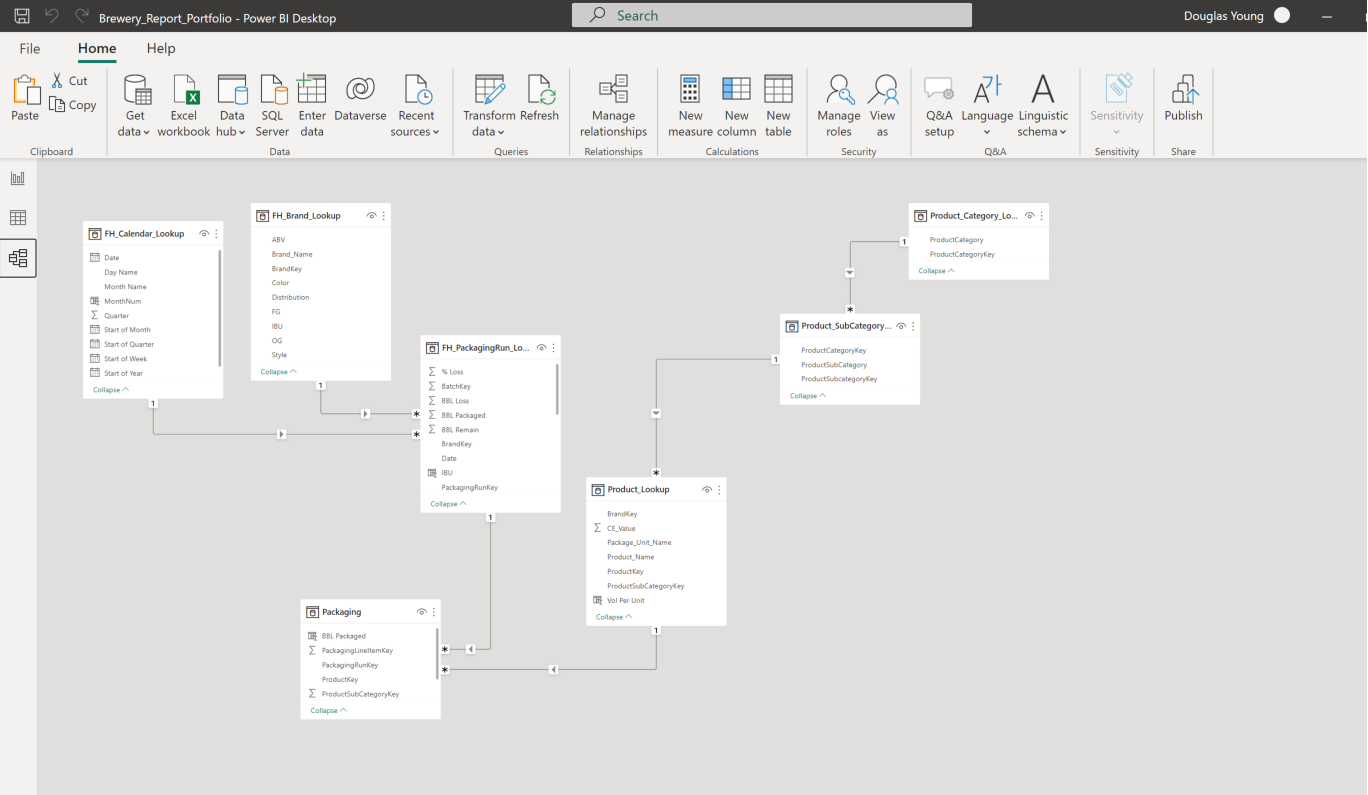
Additional related tables created to identify Brand specific information, Product Category and Sub-Category and a calendar for date-related analysis.
Dashboard Creation In Power BI


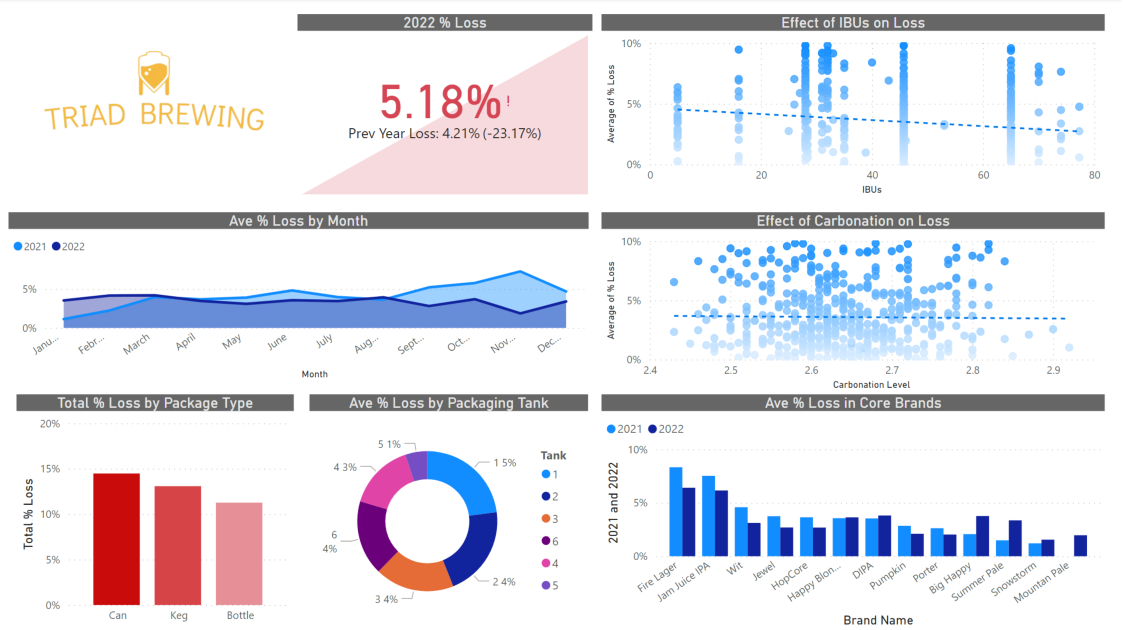
Dashboards were created to analyze and display summary information about Packaging, Brand specific information, and effects of different factors on Beer Loss.
Conclusions and Observations
An analysis of overall volume packaged concluded that Triad Brewing packaged less beer in 2022 than in 2021 by about 3,500 bbl or almost 12%. The biggest discrepancies were found in the months of July-October as compared to the previous year. Further investigation determined a correlation between a decrease in staff size and an uptick in downtime due to mechanical failure to be causative to the decreased production.
Beer loss during production increased in 2022 as compared to the previous year. Highest loss percentages were seen in canned products (~15%) with lower loss seen during Keg and Bottle runs. Examining and calibrating the operating parameters on the canline could be one corrective action.
Individual beer specs showed some correlation with beer loss but the effect was minimal. Loss decreased slightly with an increase in both IBU and Carbonation level but overall these effects were inconclusive.
The choice of packaging tank showed a higher correlation as all products packaged from Tank 5 showed significantly less loss than all other Packaging Tanks. Only 1% on average was lost when packaging out of Tank 5 as compared to 3-5% in all other tanks. Calibration of measuring devices for this tank would be reccomended to determine whether this is true correlation or mis-measurement.
