Spending Analysis
In Python and Power BI
In this project, a dental marketing company needed an analysis of how it spent money across it's various states, regions and offices within specific categories of expeneses to help project a budget for the upcoming year. The client requested a format that would enable them analyze Total Spending within specific Offices/Territories split by Month
Company and employee names and other identifying information has been changed to protect anonymity.
Initial Data Source
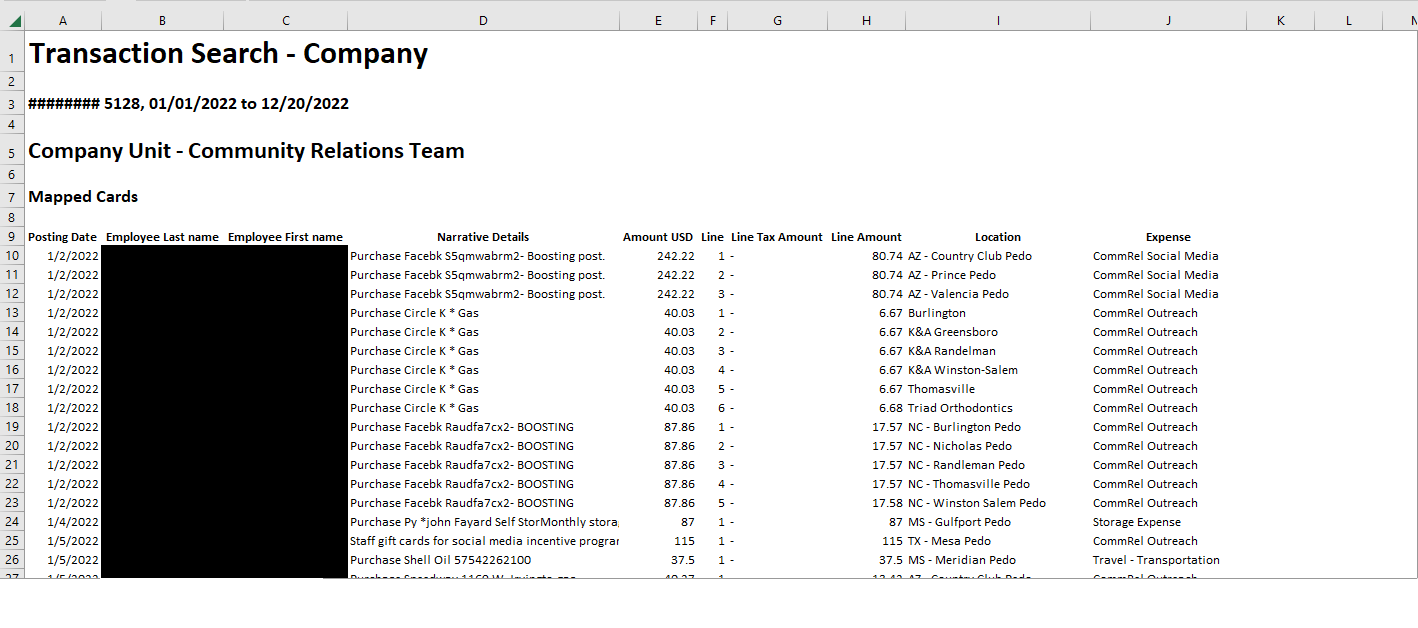
An end of year itemized expense report was obtained from the company's financial institution. It included information on each expense from the Community Relations department coded by Date, Location, General Expense Type, Line Amount, and various other details about each purchase.
Data Cleaning and Feature Engineering
The data cleaning process involved grouping similar expense codes into specific categories: "Social Media, Advertising, Outreach, Events and Other." Line items were also grouped by Month and Location. The client requested that some Locations be further categorized into Territories while others remain individual offices to see where money was being spent. Data was formatted to be filtered by Date, Practice Category (Orthodontic, Pediatric, Mobile), Office/Territory, and Category of Spending.
Transforming Data in Power BI
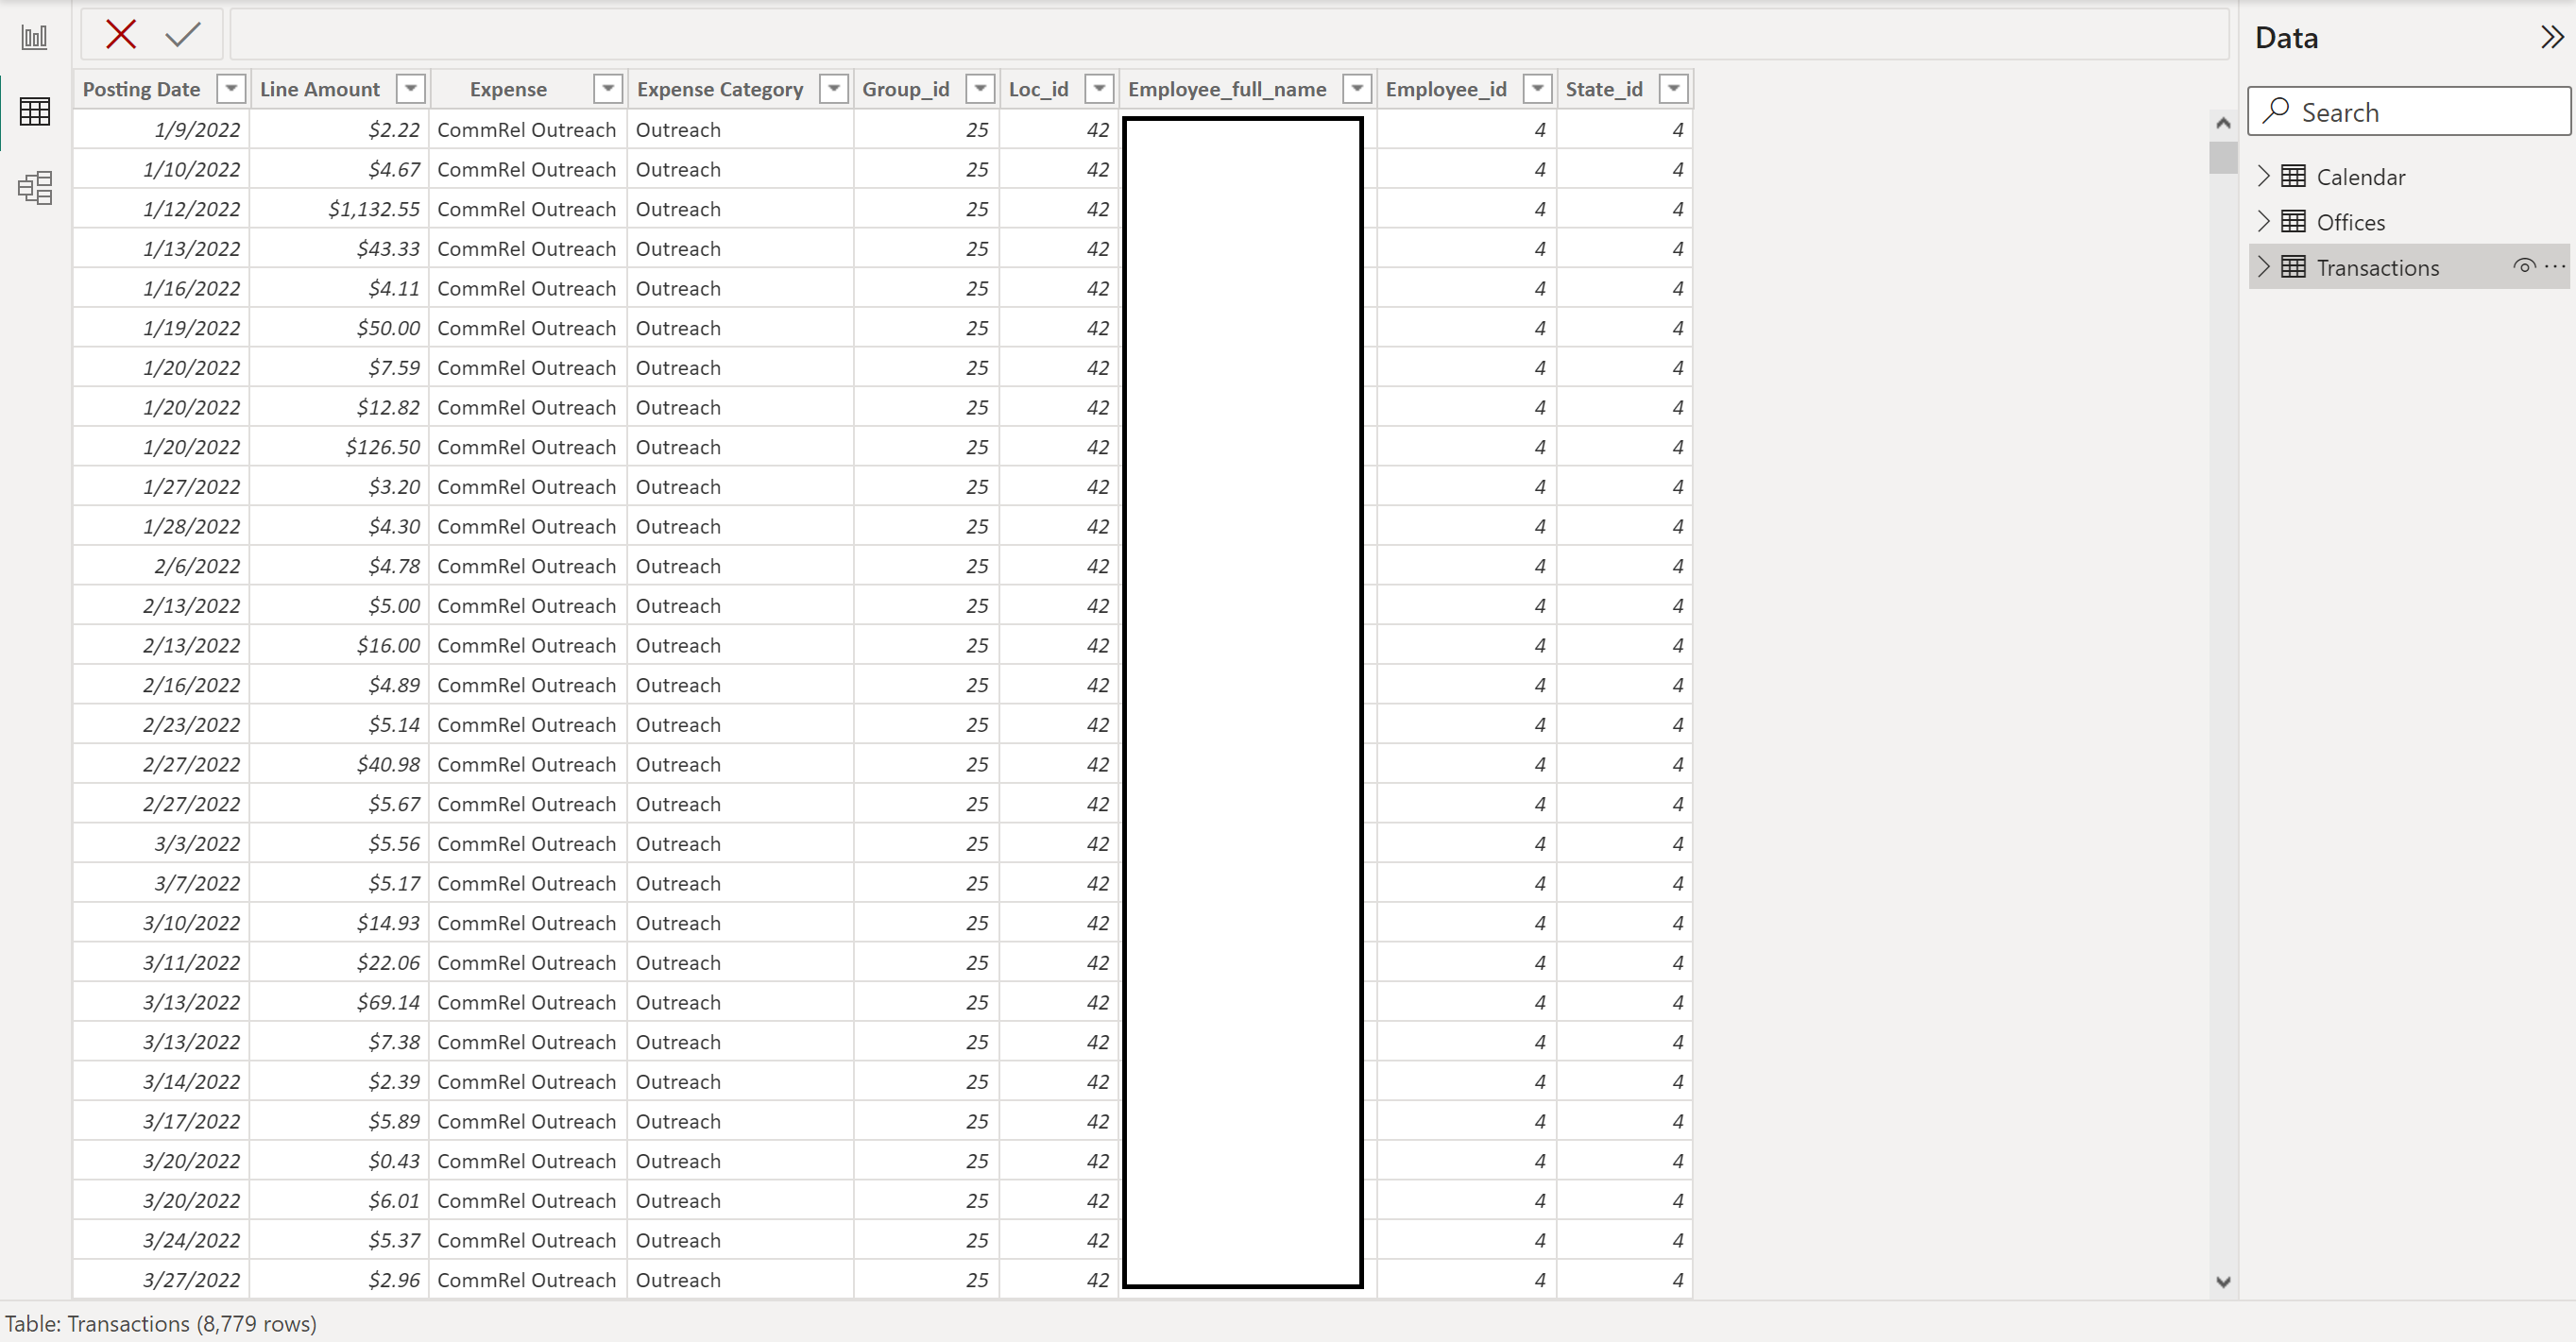
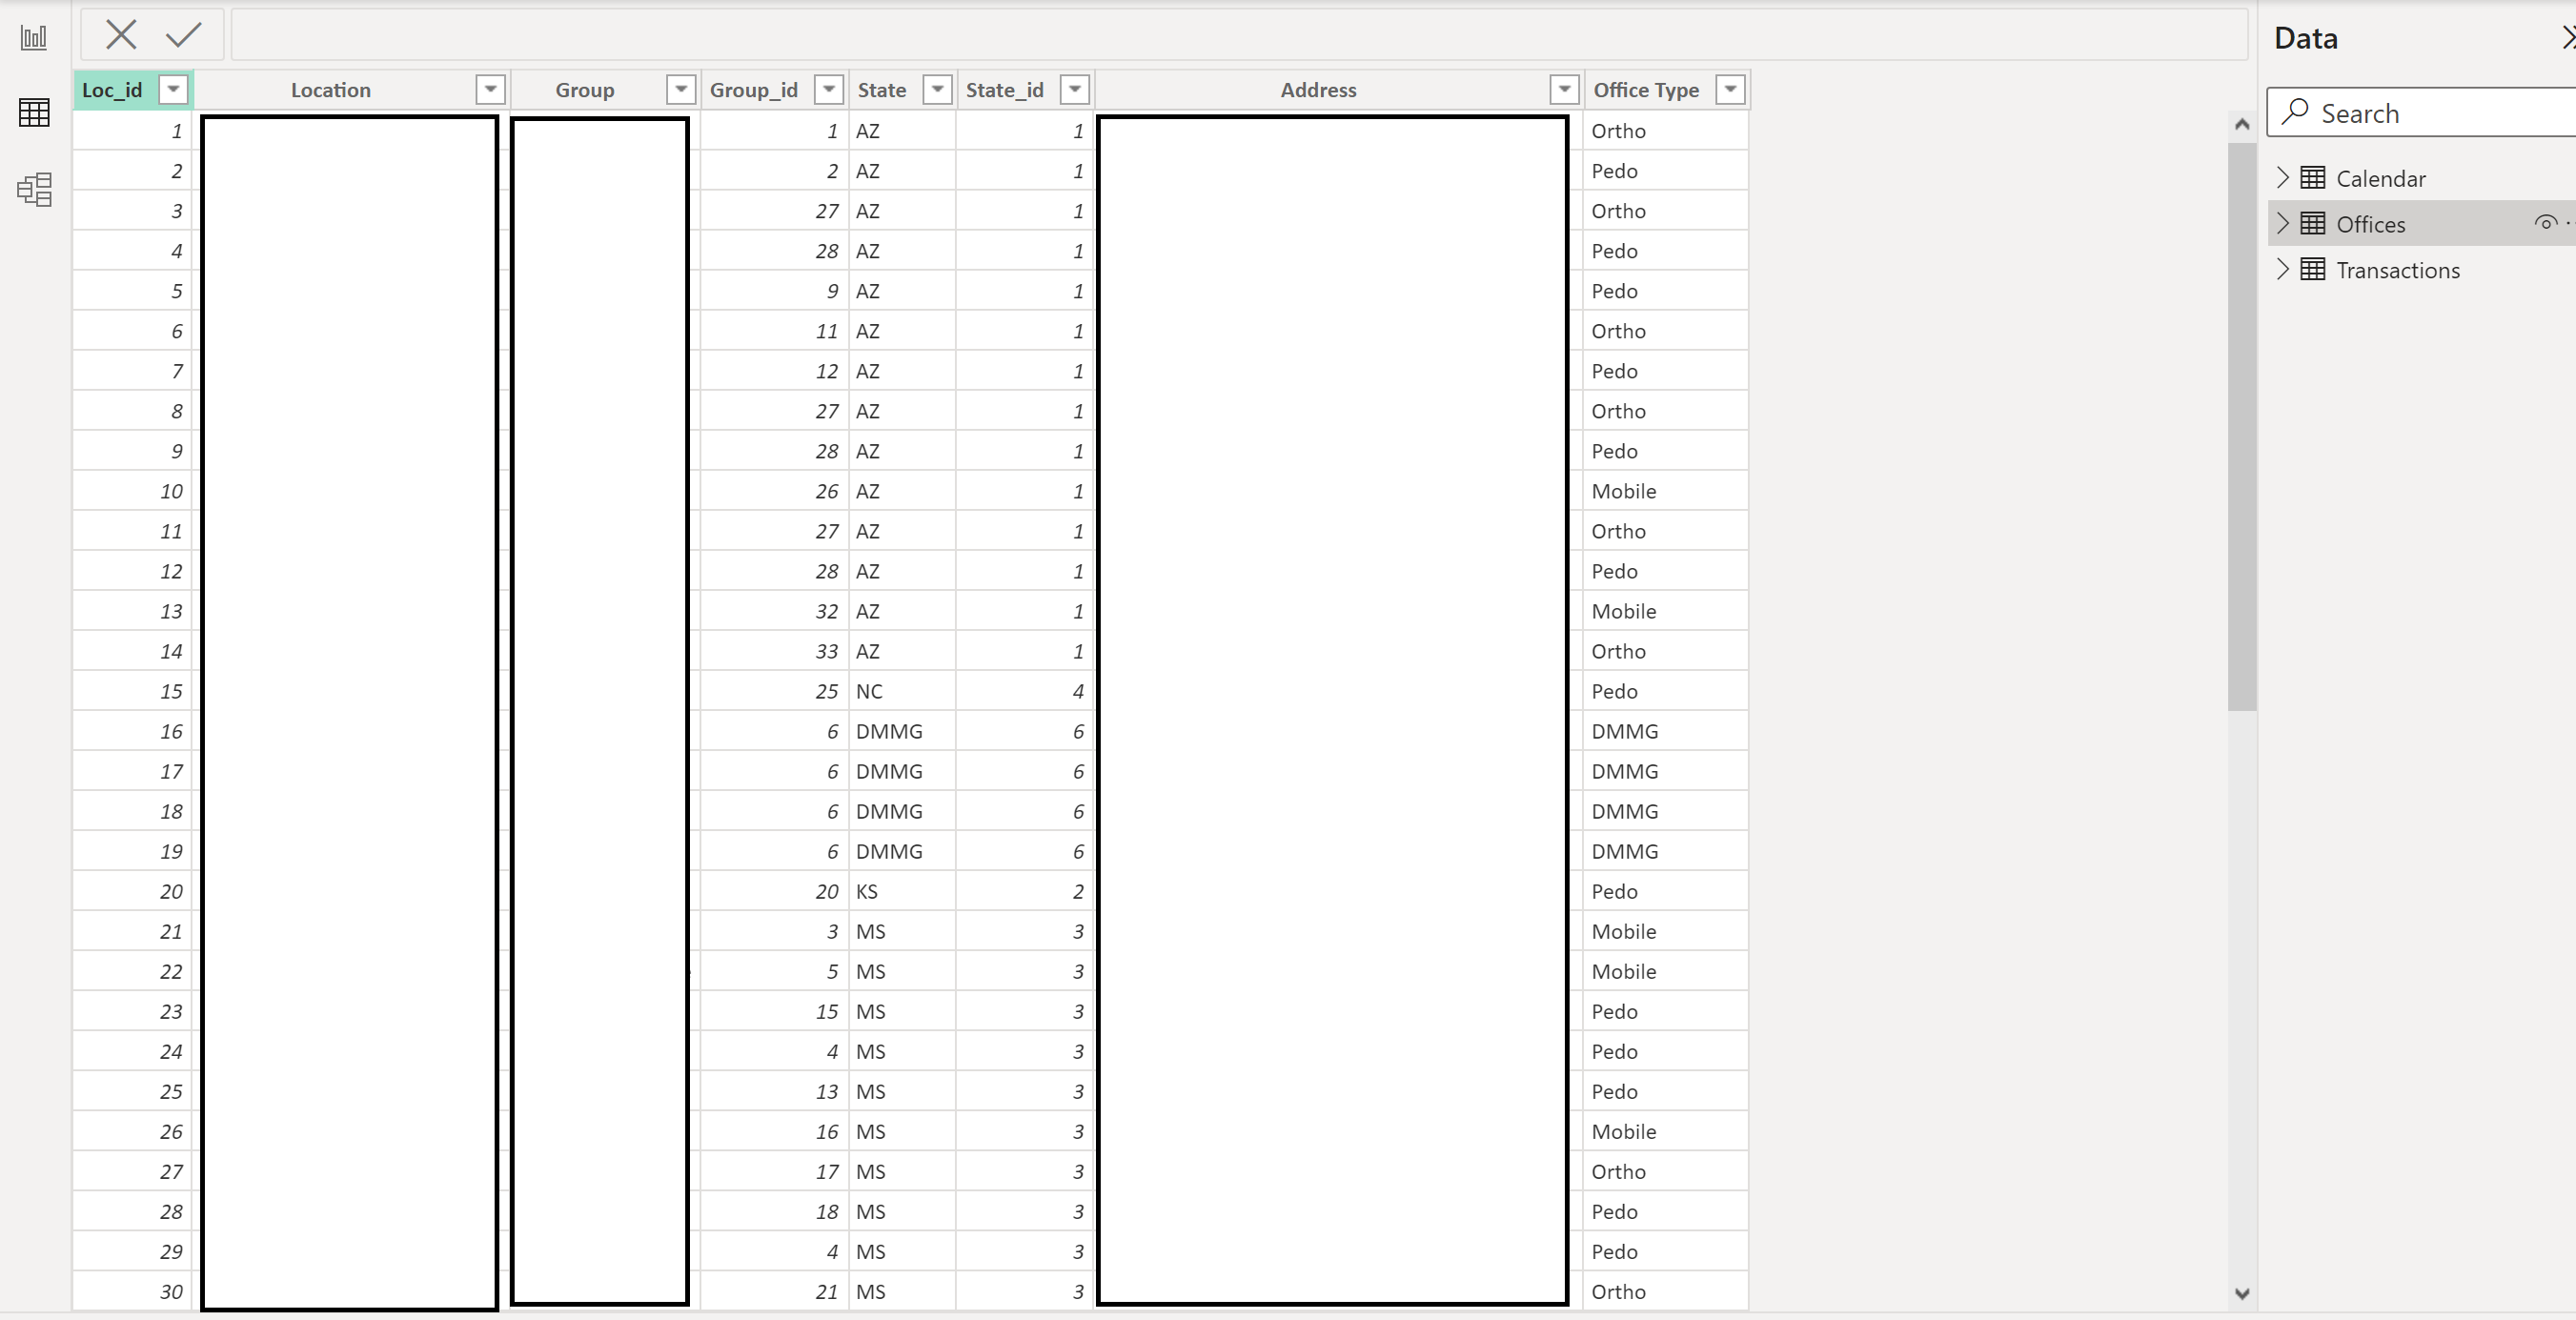
Cleaned transaction report was loaded to Power BI for analysis and visualizations. An office lookup table was also created with office specific information including address, office type and client supplied group catrgory.
Relational Tables Created
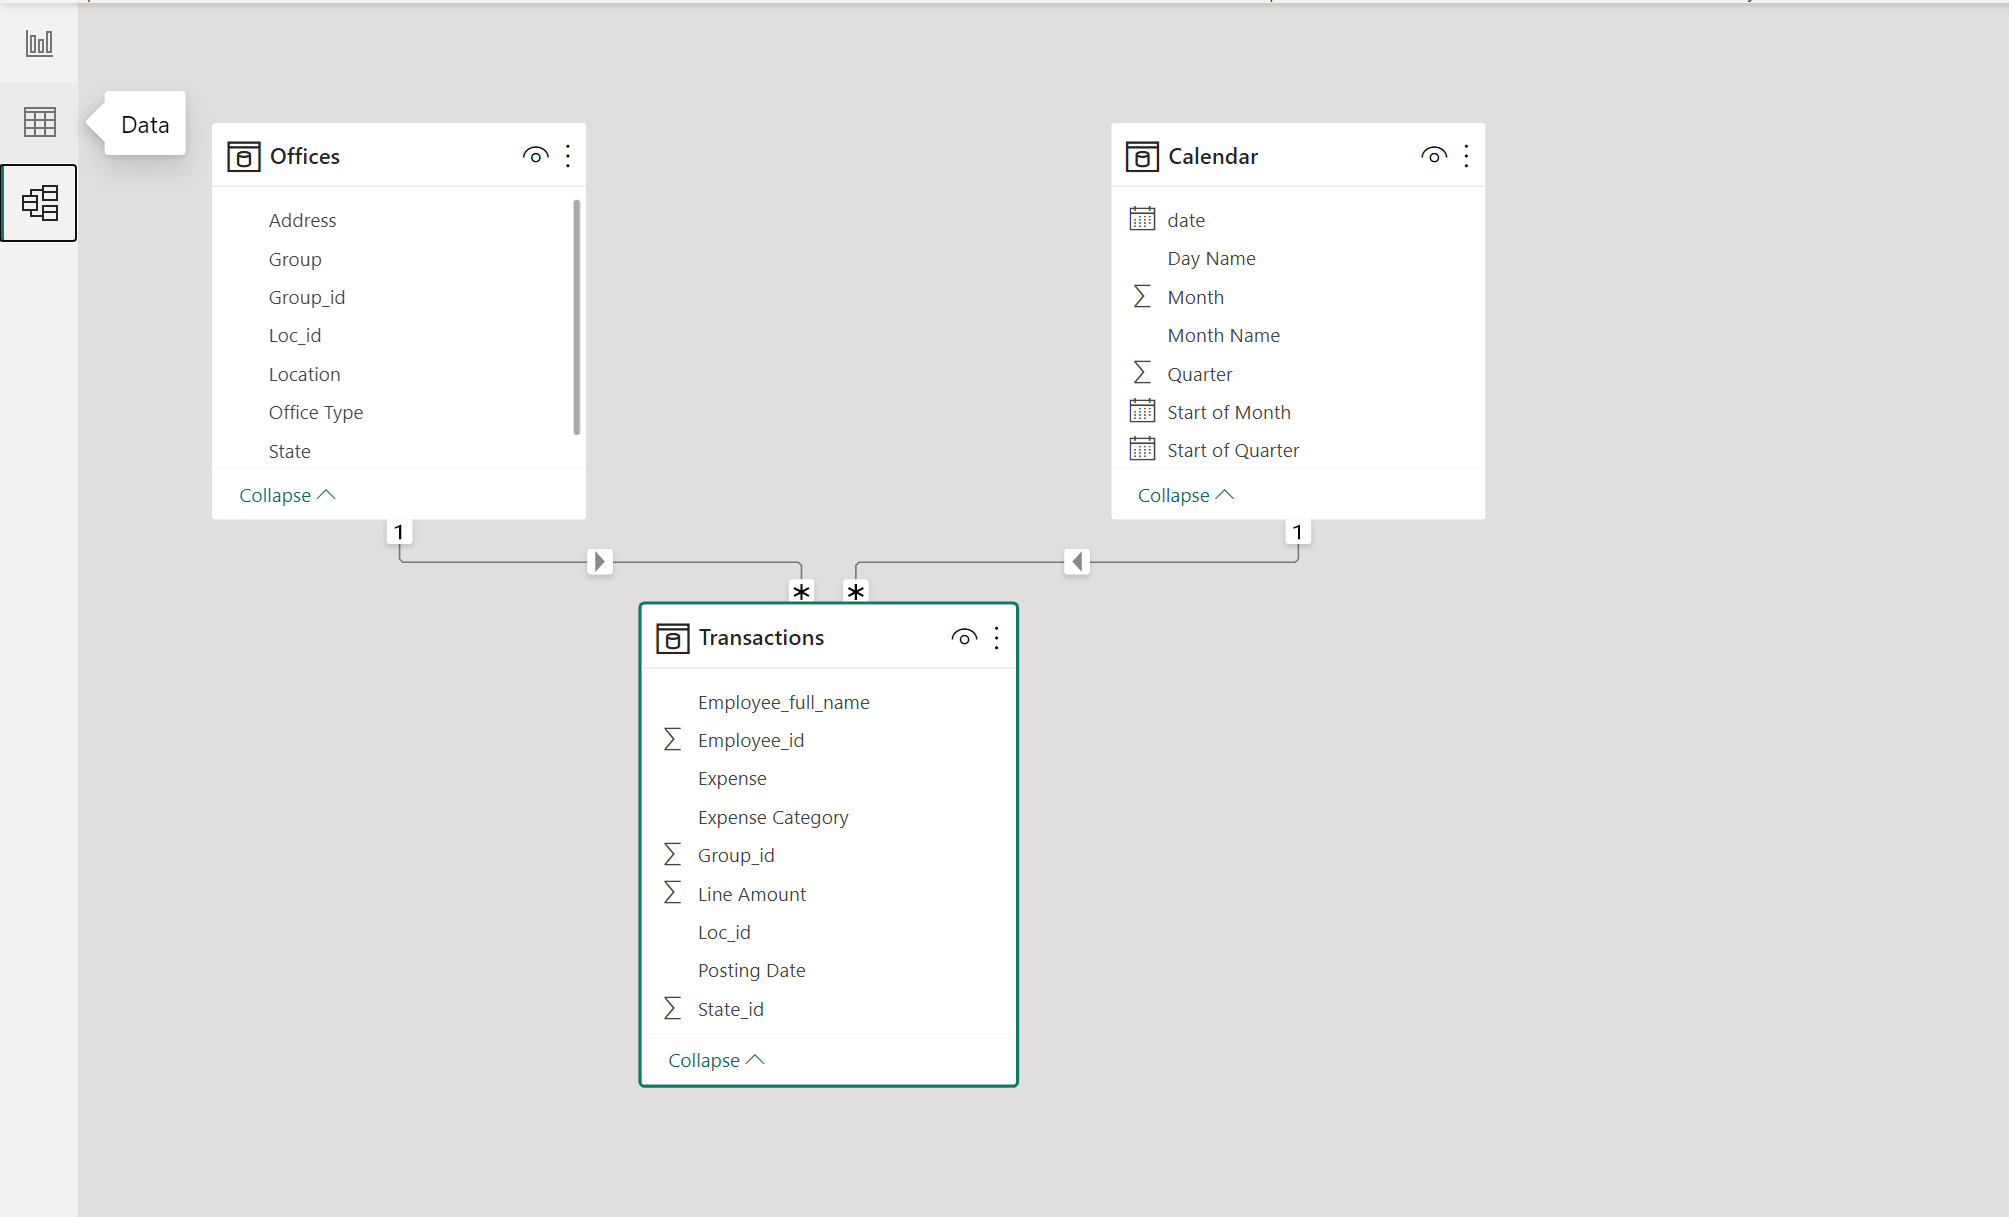
Relations were drawn to connect the two tables. A calendar lookup table was also created to analyze spending by Month
Dashboard Creation In Power BI
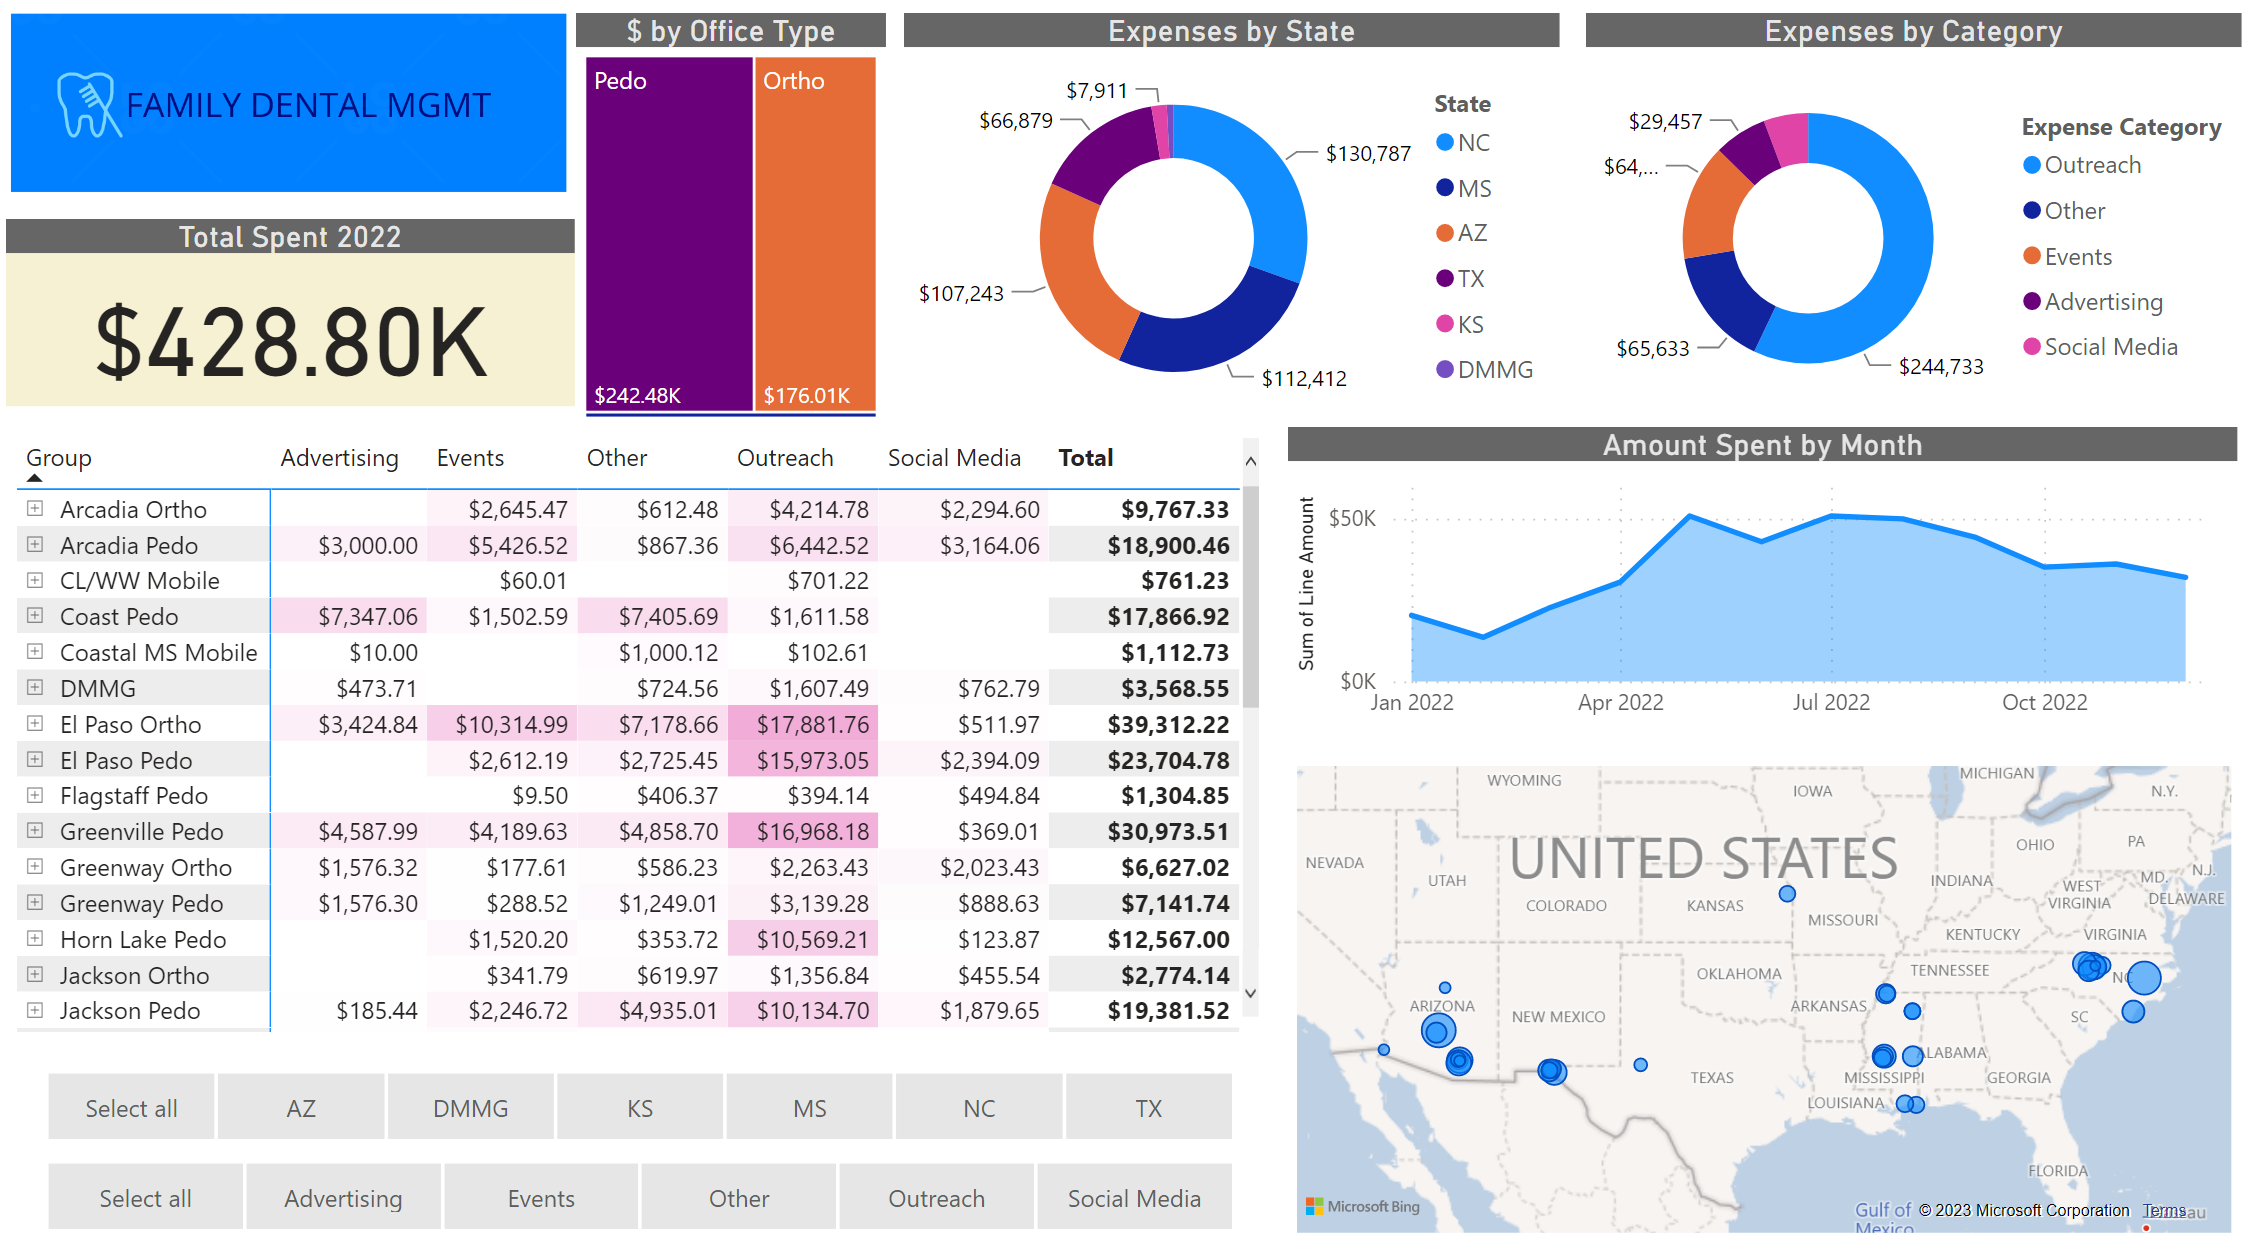
Dashboards were created to analyze spending. Report allows user to drill into spending table by Group and Month and displays categorical spending within those filters as well as a grand total. Slicers were added to easily filter by state and by spending category. Responsive geographical visualization allows user to see what territories are spending the most. Donut charts display expenses broken down by State and Category.
Conclusions and Observations
By state, the most money was Spent in NC with over $130,000 in expenses. Almost 70% of those expenses were toward Outreach. Across all Territories, 57% off all expenses were categorized as Outreach.
Event spending increased significantly in the summer months and decreased slightly in the winter months, indicating a seasonality in spending habits, likely correlated to outdoor promotional events. Higher budgetary needs could be expected in these months.
Of the $428k spent in 2022, 56% went toward Pediatric Practices at $242.5k while Orthodontic Practices spent 41% at $176k. Mobile dentistry comprised only 1.5% of the total spending with $6700.
